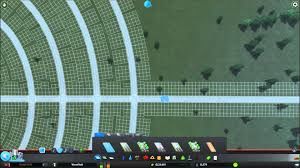
Ok, based on the images you posted and some other images I saw online, it seems like there might be some nontrivial aspects to it. But, I'll speculate a bit.
The first step is just to be able to deal with non-axis-aligned grids in general. For this you'd need a transform (typically a position and two orthogonal unit-length basis vectors, possibly in matrix form), the grid size in cells, the cell size, and any other needed data (for example, I see that some cells appear to be disabled in some of the grids, so you might need a per-cell flag for this).
Once you have this information, you can perform operations like finding the cell that contains a point and so on. A typical approach for at least some of these operations would be to transform the point (or whatever) into the local space of the grid, and then perform the operation in local space.
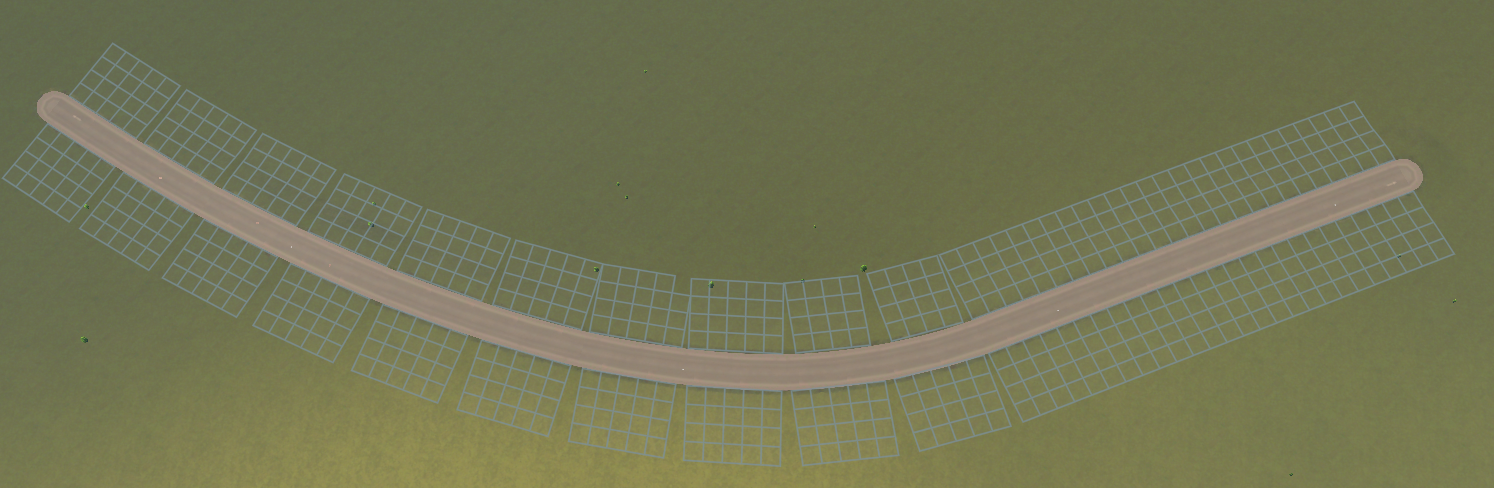
The next thing I notice is that parts of grids are disabled in order to keep grid cells from overlapping. Intersection between oriented rectangles in 2-d can be tested for robustly using separating axis tests, so it seems like it'd be relatively straightforward to determine where grid cells would overlap. You could then apply some criteria to determine which cells to disable (based on the images, it seems that part might be a little more involved).
As for placing grids along curves, you can build a local transform for a point on a curve by computing the tangent to the curve at that point to get one basis vector, with the other basis vector being the (possibly negated) perp of that vector. The details of computing the tangent depend on the type of curve (e.g. circular, Bezier, simple sequence of line segments, etc.).
How to select sizes for grids and how to place them along the curve is a little less obvious. Considerations include the curvature of the curve, keeping grids from overlapping, and so on. In the first image you posted, for example, you can see these considerations in play with the size, number, and placement of the grids, and in how the last straight section has single large grids associated with it. It seems to me this is where most of the difficulty would lie - in choosing grid sizes and placement and dealing with grids (both from the same curve and from different curves) overlapping.
I don't know how helpful that is, but maybe it'll at least give you some ideas to work with.